
14.2 Quality Control
The outstanding level of quality achieved by KSG is down to standardized manufacturing, strict quality controls and, of course, process control and continuous process monitoring.
Process Monitoring and Control
Back to top
Only by monitoring the process parameters can we ensure consistent product quality that meets our customers’ requirements. That is why KSG carries out extensive process inspections at every stage of production. The resulting process data is then used as a basis for continuously improving production processes.
Chemical Processes
- All relevant process parameters are continuously monitored using state-of-the-art technical equipment.
- Systematically repeated control analyses ensure plausible measurement results.
Physical Processes
- Using the very latest equipment, we create and inspect microsections of our products, and document the results.
- The layer thicknesses and compositions of surface finishes are inspected using X-ray fluorescence spectroscopy.
- Solderability tests are carried out in our laboratory according to IPC specifications.
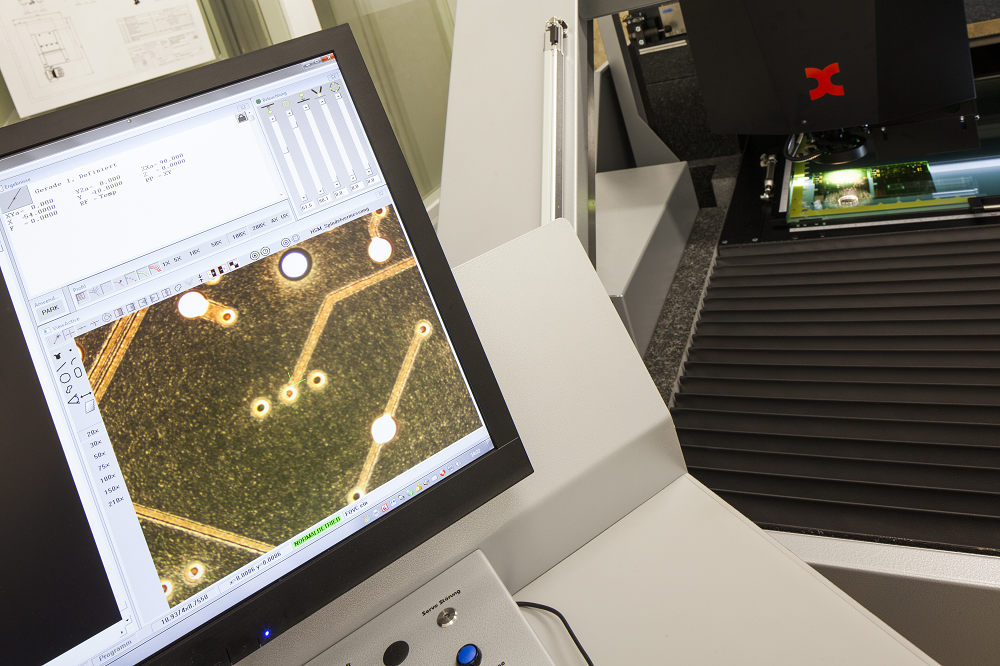
3D Coordinate Measuring Machine
This measuring system is used to check the results of the drilling, milling, and exposure processes.
With the aid of a color CCD detector and transmitted light scanner, dimensional checks are carried out with an accuracy of ± 3 µm.
With the aid of a color CCD detector and transmitted light scanner, dimensional checks are carried out with an accuracy of ± 3 µm.
Product Control
Back to top
We ensure the quality of our printed circuit boards by carrying out stringent process and product inspections at regular intervals during production. These inspections accompany the product on its journey from the work preparation stage right through to electrical testing.
Design Rule Check
During the design rule check, our experts use standard IPC design parameters to verify the plausibility of your layout data and check whether your layouts can actually be produced. In this way, we are able to detect possible errors before production begins and create the right conditions for your PCB to be produced without a hitch. Naturally, we will contact you immediately in the event of any ambiguities – or even any minor issues we notice – to seek written clarification.
At KSG, every PCB goes through the design rule check.
Learn more
At KSG, every PCB goes through the design rule check.
Learn more

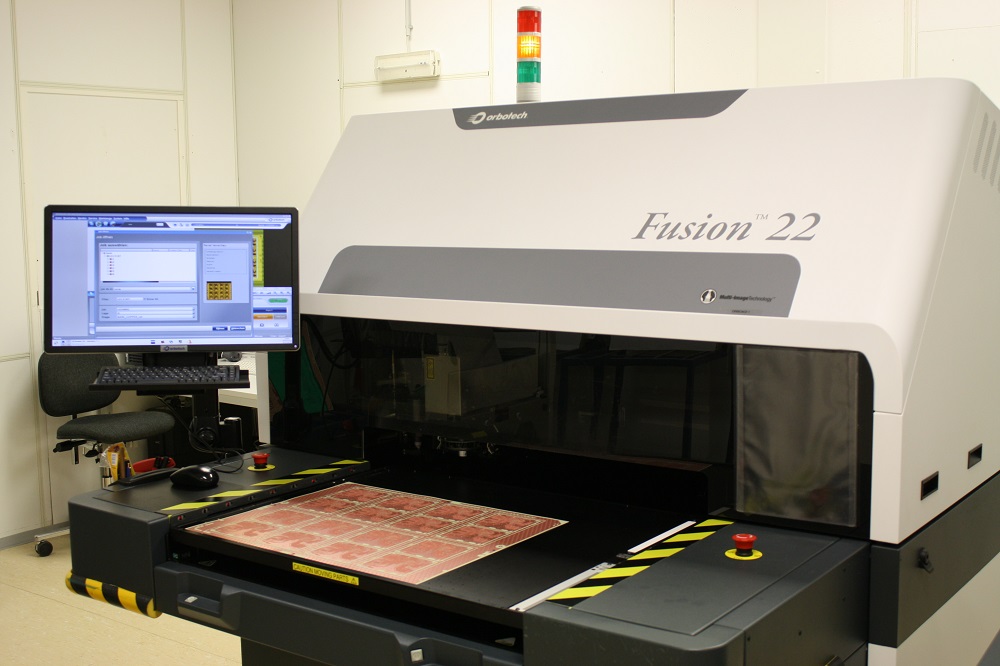
AOI (Automated Optical Inspection)
During the automated optical inspection, we compare the etched conductive pattern against the CAM data.
Our equipment is capable of checking even the most complex of traces.
Detected faults are verified and systematically recorded by means of fault codes. The resulting statistical analyses are used to continuously improve the upstream conductive pattern creation processes,
such as exposure, development, and etching.
X-Ray Technology
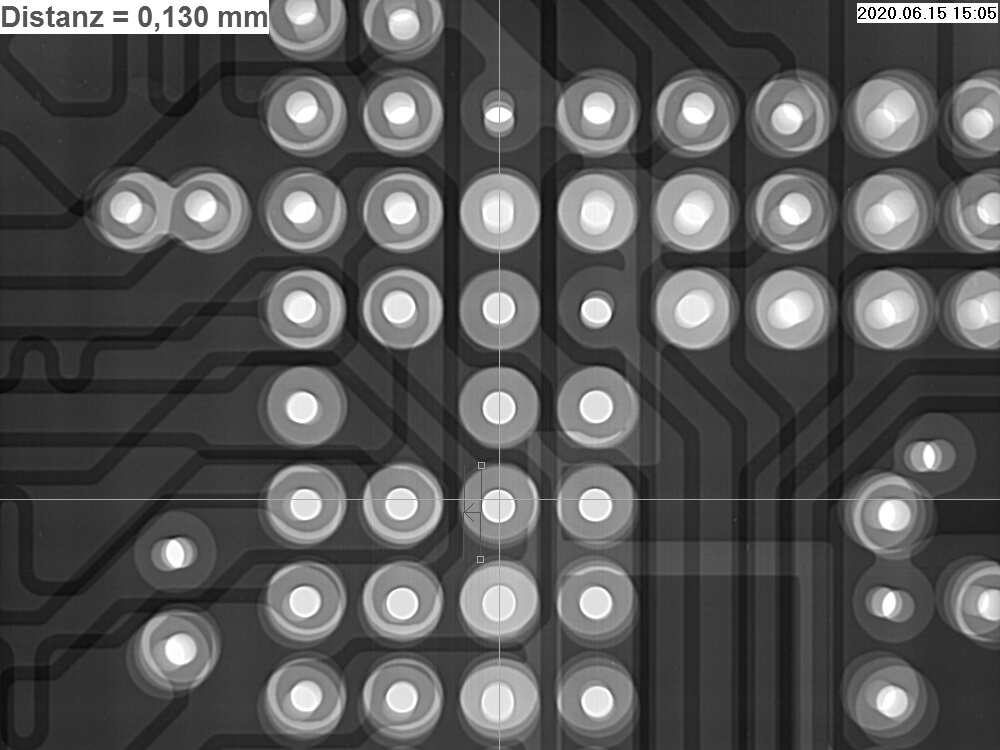
X-ray drilling machines are used to achieve optimum fitting accuracy and to align the drilling programs with the conductive pattern of the inner layers of a multilayer.
X-ray technology is also used during production for product control purposes and for monitoring the various processes – such as exposure, etching, development and mechanical drilling, laser drilling – for optimum registration.
X-ray technology is also used during production for product control purposes and for monitoring the various processes – such as exposure, etching, development and mechanical drilling, laser drilling – for optimum registration.
Reliability Investigations
Back to top
Assessment of Reliability in the Temperature Cycling Test with In-Situ Resistance Measurement
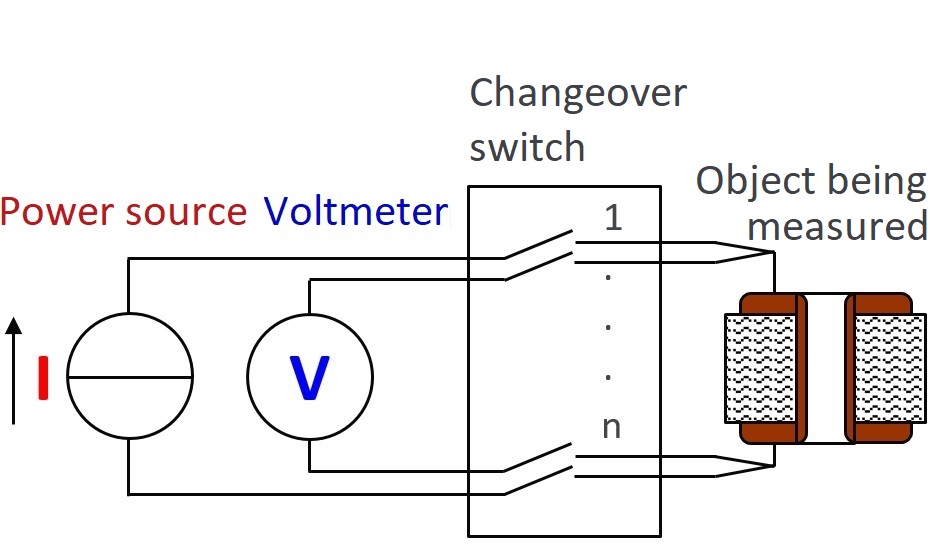
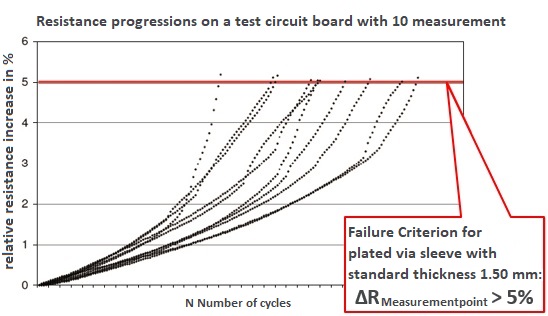
The long-term reliability of PCBs under thermomechanical alternating load is assessed with an in-situ resistance measurement method. Cracking in copper is divided into the following phases: crack initiation, stable cyclic crack propagation, and unstable final fracture. The crack propagation phase is characterized by cracks that gradually propagate perpendicular to the greatest normal stress (i.e., with each cold-hot temperature cycle). As a result of the associated reduction in conductor cross-section, there is an increase in the ohmic resistance of the affected electrical connection elements, such as through holes or blind holes. This relative increase in resistance of a connection element is recorded in-situ during the temperature cycling test using the 4-wire resistance measurement principle.
Image on right: Circuit diagram of 4-wire resistance measurement during temperature cycling test
The temperature-related resistance changes are corrected using copper reference structures.
The measured connection element – such as a through hole – is deemed to have failed if a permissible maximum value for the relative increase in resistance is reached (e.g., 5 %). This allows the crack-induced change in electrical behavior to be characterized independently of the probability of cracks being detected in the microsection. Customer-specific failure criteria can also be defined..
Image on right: Resistance curves due to crack propagation in the temperature cycling test
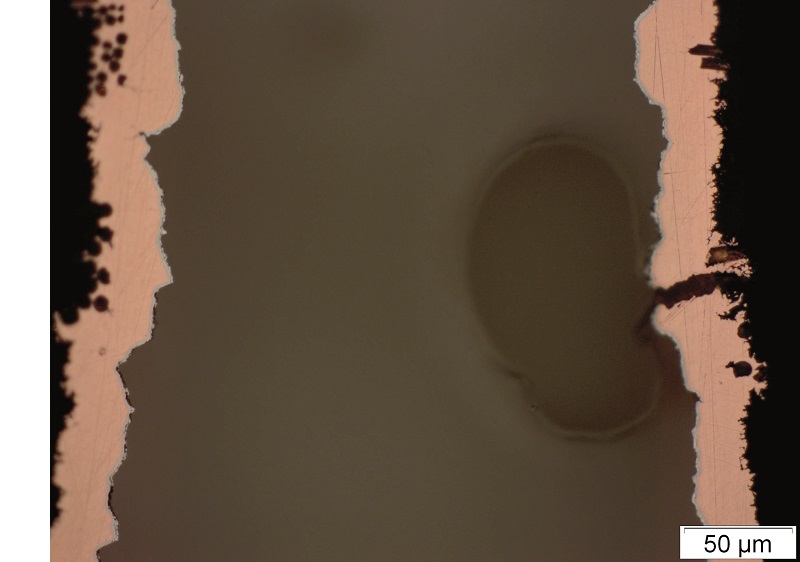
When determining the failure criterion, it is important to consider geometric design specifications such as the PCB thickness and Cu plating thickness. For example, the damage pattern for a hole with an aspect ratio (AR) of 10:1 differs significantly from that for a hole with an aspect ratio (AR) of 6:1 with the same relative increase in resistance.
Image on right: Damage pattern for a metallized through hole with an aspect ratio (AR) of 10:1 and a 5 % increase in resistance
Image on right: Damage pattern for a metallized through hole with an aspect ratio (AR) of 10:1 and a 5 % increase in resistance
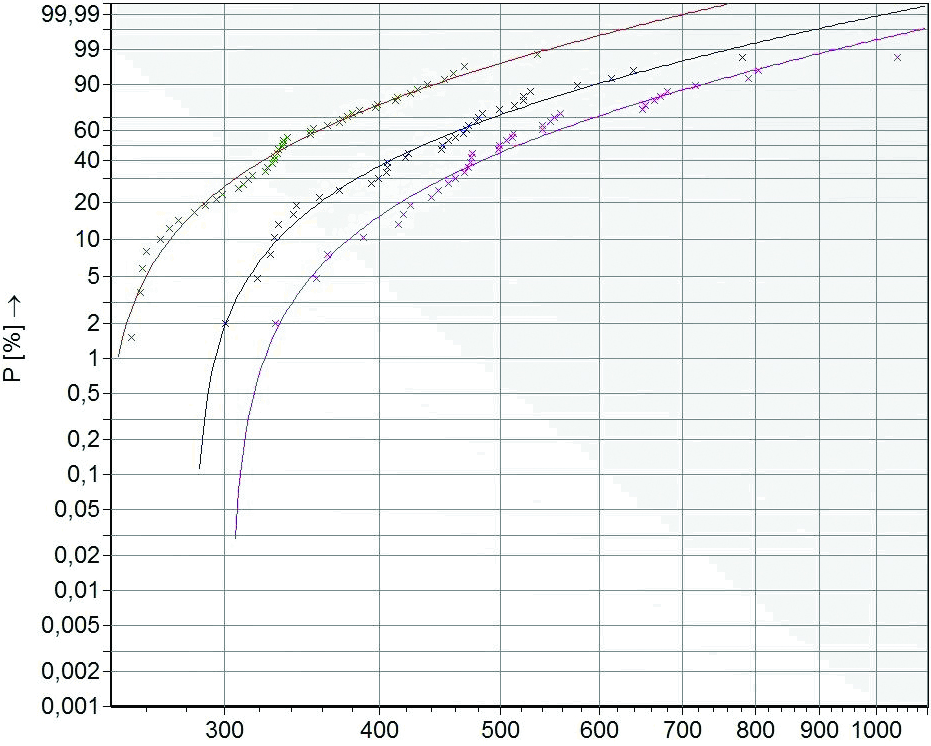
The high accuracy of the resistance measurement provides low-noise data during the load test itself, subsequently resulting in very good correlation coefficients of > 0.98 when the statistical analysis is carried out with the Weibull distribution.
This powerful and efficient reliability assessment is used to perform material and technology qualification processes.
Image on right: Failure data with Weibull fits for metallized through holes with different hole diameters (0.15, 0.20, and 0.25 mm)
This powerful and efficient reliability assessment is used to perform material and technology qualification processes.
Image on right: Failure data with Weibull fits for metallized through holes with different hole diameters (0.15, 0.20, and 0.25 mm)
Qualified Test Methods
Back to top
Our processes have undergone qualification according to the following test methods
Thermal shock test according to IPC-6012 3.10.8; IPC-TM-650 No. 2.6.7.2
Number of cycles: 100 for Tg 130 material
temperature range: - 55 °C to +105 °C
Number of cycles: 1,000 for Tg 150 material
temperature range: - 55 °C to +125 °C
Holding time: 15 min each
Number of cycles: 100 for Tg 130 material
temperature range: - 55 °C to +105 °C
Number of cycles: 1,000 for Tg 150 material
temperature range: - 55 °C to +125 °C
Holding time: 15 min each
Thermal stress test according to IPC-6012 3.6.1.1; IPC–TM-650 No. 2.6.8
Solder bath: Sn60Pb40, solder bath temperature: 288 ± 5 °C
dwell time in the solder: 10 sec. floating on the solder bath
Solder bath: Sn60Pb40, solder bath temperature: 288 ± 5 °C
dwell time in the solder: 10 sec. floating on the solder bath
Keywords
- Automated optical inspection (AOI)
- X-ray inspection
- Design rule check (DRC)
- Reliability
- Test and measurement methods