
4.1 Base Materials
- General
- Material Components - General
- Properties of PCB Base Materials
- 1) Thermal Property – Glass Transition Temperature Tg
- 1) Thermal Property – Time to Delamination T260/T288
- 1) Thermal Property – Decomposition Temperature Td
- 2) Physical Property – Thermal Expansion CTE
- 2) Physical Property – Cycle Stability
- 3) Electrical Property – High Data Rate/High Frequency
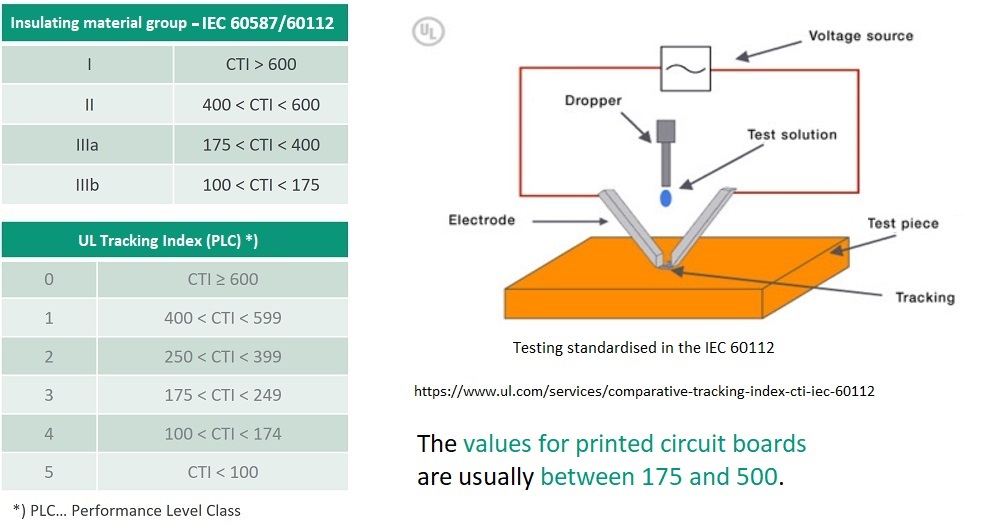
- 3) Electrical Property – Comparative Tracking Index CTI
- 3) Electrical Property – Conductive Anodic Filament CAF
- Moisture absorption of Base materials/PCBs
Classification according to IPC-4101
The requirements for the base material are defined in “IPC-4101”.The standard grade is FR4 (FR5)
- FR ... Flame retardant
- FR4 ... Glass fabric, epoxy resin, flame retardant
- FR4.1 ... Glass fabric, epoxy resin, flame retardant, halogen-free (or low halogen)
- FR5 ... Glass fabric, epoxy resin, flame retardant, increased temperature stability
PCB base material consists of three basic components:
GlassResinCopper

IPC-4101: Specification for Base Materials for Rigid and Multilayer PCBs
Glass
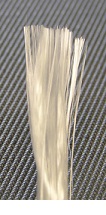
The greater the filament thickness, the more dimensionally stable the fabric.
Due to the fabric pretension – which mainly stems from the glass fabric tension that arises during coating in the “treat process” – the shrinkage behavior tends to be greater in the warp direction than in the weft direction. For this reason, the warp direction is indicated by manufacturers in the case of both laminates and prepregs.
| Fabric type | Thread count/cm warp / weft | Filament thickness [µm] | Tex number [g/km] warp / weft |
|---|---|---|---|
| 106 | 22 / 22 | 5 | 5.5 / 5.5 |
| 1080 | 24 / 18.5 | 5 | 11 / 11 |
| 2116 | 24 / 23 | 7 | 22 / 22 |
| 7628 | 17 / 12 | 9 | 68 / 68 |
Resins
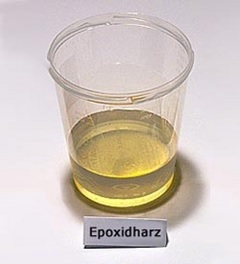
The coefficient of expansion (α) of the pure resin is determined by the molecular weight distribution.
The coefficient of expansion (α) increases significantly in temperature ranges > the glass transition temperature Tg.
Rule of thumb: α(z direction) ≈ α(resin)
Fillers can influence α(z direction).
The dimensional stability of laminates and prepregs is primarily influenced by the glass fabric in the x/y direction.
The epoxy resin has a secondary influence on the dimensional stability in the x/y direction.
Copper foils
ED (electrodeposited) copper foils are the most frequently used type for PCBs. The copper is electrolytically deposited from a solution onto a slowly rotating drum. This process creates a smooth side facing the drum (drum side) and a rougher side (air side). The roughness of the rougher side is usually increased by a downstream process sequence and a “treatment” is applied.
Copper foils have what is known as a treatment side with roughness values of ≈ 2 – 15 µm.
This treatment side is responsible for the level of adhesion to the resin and, depending on the roughness, achieves a minimum of 1 N/mm².
For high-frequency applications, copper foils with very low roughness are typically used because of the skin effect.
Skin effect: At high frequencies, the magnetic HF field displaces the current flow from the conductor. The conductive layer is called the skin depth or depth of penetration δ.
IPC-4562: Metal Foil for Printed Wiring Applications
| Weight [oz] | Thickness acc. to IPC 6012 [µm] | Minimum thickness acc. to IPC 4562 [µm] (*) | Minimum thickness acc. to IPC 6012 [µm] (**) |
|---|---|---|---|
| 1/8 oz | 5.1 | 4.6 | 3.1 |
| 1/4 oz | 8.5 | 7.7 | 6.2 |
| 3/8 oz | 12.0 | 10.8 | 9.3 |
| 1/2 oz | 17.1 | 15.4 | 11.4 |
| 1 oz | 34.3 | 30.9 | 24.9 |
| 2 oz | 68.6 | 61.7 | 55.7 |
| 3 oz | 102.9 | 92.6 | 86.6 |
| 4 oz | 137.2 | 123.5 | 117.5 |
(*) Minimum thickness for copper foil producers according to IPC 4562 minus 10 %
(**) Minimum thickness after processing by PCB manufacturing processes according to IPC 6012
1) Thermal properties
(temperature stability)
2) Physical properties
(thermomechanical stability)
3) Electrical properties
- Glass transition temperature Tg
- Time to delamination T260/T288
- Decomposition temperature Td
- Thermal expansion
- Z-axis expansion CTE-z
- Cycle stability
- High data rate/high frequency (permittivity Dk,
dielectric loss factor Df) - Comparative tracking index CTI
- Conductive anodic filament CAF
Glass Transition Temperature Tg - Basics
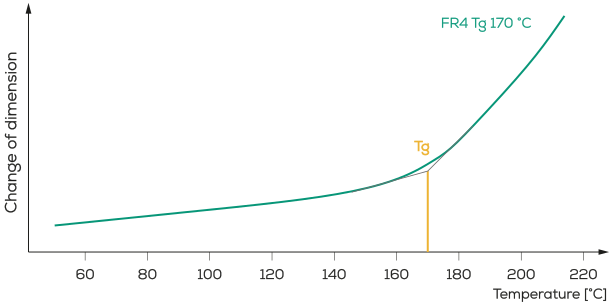
The glass transition temperature (Tg) indicates at what temperature the resin matrix changes from the vitreous, brittle state to the plastic, soft state.
- Tg = bend or inflection point in the curve
- Tg depends on the degree of cross-linking of the resin matrix (number of epoxy groups per molecule)
- Degree of cross-linking ↗ Tg ↗
- The Tg value only provides information about the continuous operating temperature of the PCB
- The values are usually between 130 °C and 260 °C
Glass Transition Temperature Tg – Methods of Determination
- The various methods provide different results:
Tg (DMA) > Tg (DSC) > Tg (TMA) - Guide value: Tg(TMA) = Tg(DSC) – 10 °C = Tg(DMA) – 20 °C
- Tg (DSC) usually serves as the basis for comparison in datasheets and publications
Tg determined by the change in expansion behavior
DSC - Differential Scanning Calorimetry
Tg determined by the change in thermal capacity
DMA - Dynamic Mechanical Analysis
Tg determined by the change in the elastic modulus and damping behavior
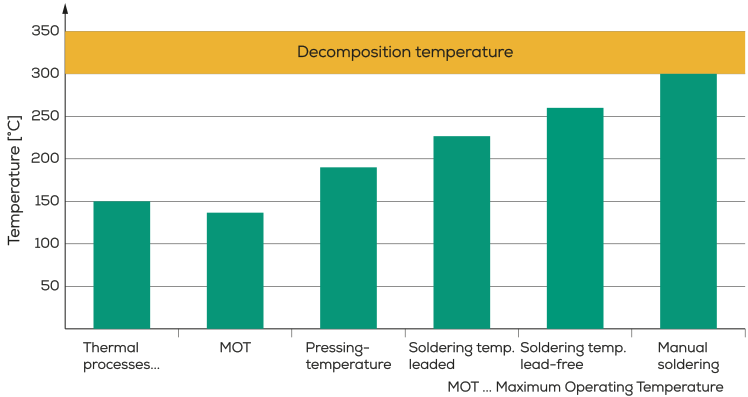
Glass Transition Temperature Tg – Continuous Operating Temperature
Overview of Typical Temperatures for PCB Processes
- The higher the Tg, the longer the coefficient of expansion z-CTEα₁ remains constant over a wider temperature range
(for more on this, see the physical properties) - Short-term overshooting of the temperature is permissible (during production, soldering)

| Material description | Tg [°C] | Max. continuous operation [°C] MOT … Maximum Operating Temperature |
|---|---|---|
| Standard Tg base material | 130 | 100 |
| Medium Tg base material | 150 | 120 |
| High Tg base material | 170 | 140 |
The time to delamination indicates how long it takes for delamination to occur in the composite material according to the temperature (260 °C or 288 °C)
- Composite delamination between glass fiber/resin and copper/resin
- T260/T288 depends on the resin matrix (hardener, flame retardant, etc.)
--- Phosphorus flame retardant (halogen-free FR4)................T260/T288 ↗
--- Curing with phenolic hardener (thermostable FR4)....T260/T288 ↑
- The higher the T260/T288, the lower the risk of bond failures in the base material under permanent or cyclic temperature load
- A high T260/T288 provides safety margins for lead-free production and processing
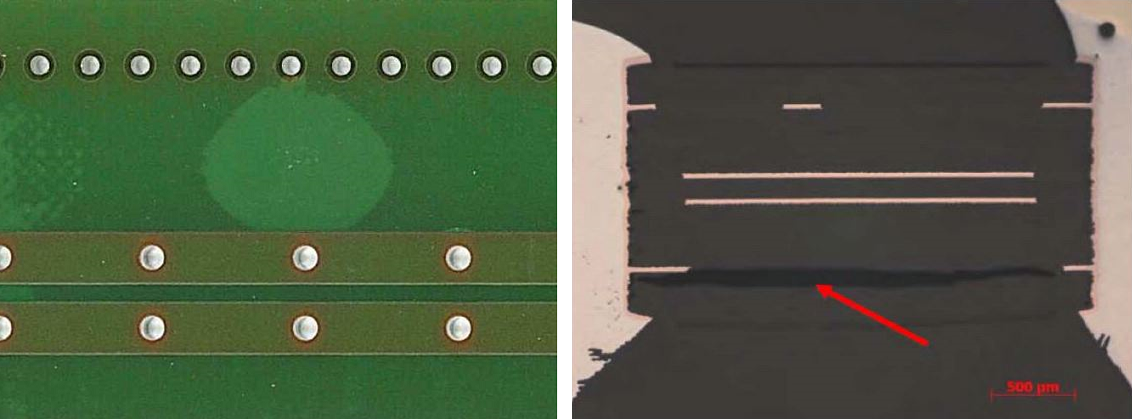
Rule of thumb: The higher the temperature, the shorter the solder contact time
The decomposition temperature Td indicates the temperature at which significant decomposition of the resin matrix occurs. TD-point (Decomposition Temperature) Td = decomposition point of the resin polymers
- Temperature of incipient mass loss or temperature at 5 % mass loss (Td 5%)
- Td depends on the resin matrix (hardener, flame retardant, etc.)
--- Curing with dicyandiamide (standard FR4)........................................Td →
--- Phosphorus flame retardant (halogen-free FR4)......................Td ↗
--- Curing with phenolic hardener (thermostable FR4)...........Td ↑
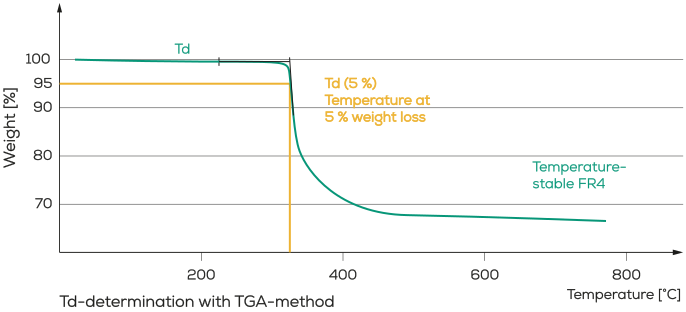
- The higher the Td, the lower the pre-damage inflicted on the base material under thermal stress
- A high Td provides safety margins for lead-free production and processing
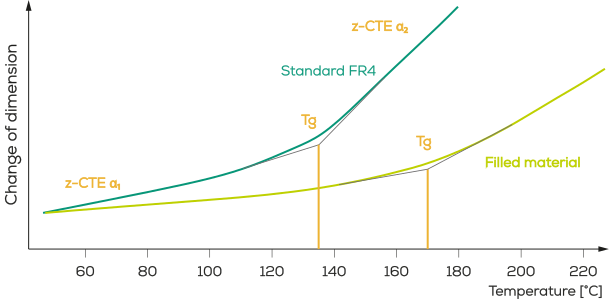
Thermomechanical stability CTE (coefficient of thermal expansion)
CTE-z / Tg determined with the TMA method
- Thermal expansion behavior of the base material in the x-y direction
- Thermal expansion behavior of the base material in the z direction
- In addition to the hole diameter, copper thickness in the hole, and thickness of the PCB, another decisive factor for the cycle stability is the expansion behavior in the Z direction
- The transition point depends on the degree of cross-linking of the resin matrix (see Tg)
- C-CTE depends, among other things, on inorganic fillers in the resin matrix (SiO2, Mg(OH)2, Al(OH)3, etc.)
- The CTE value increases significantly above Tg (typically > 180 ppm/K)
- The expansion in the x and y directions plays only a minor role compared to the z direction (values of 12 – 17 ppm/K)
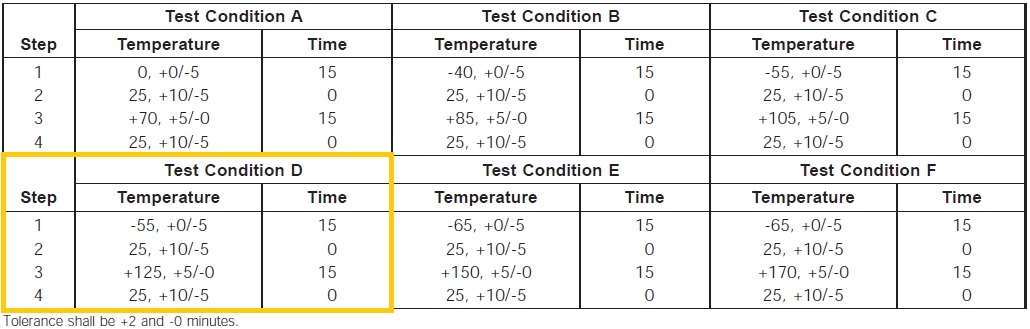
Cycle Test According to IPC-TM-650 2.6.7.2
IPC-TM-650 2.6.7.2 Test Conditions
In the IPC guideline for IPC-TM-650 test methods, six different test conditions (A to F) are defined in relation to cycle stability/cycle tests.
Example: Test Condition D:
Lower test temperature Ta: - 55 °C
Upper test temperature Tb: + 125 °C
Dwell time t1: 15 min
Basic Principles for Improving Dimensional Stability in the Z-X-Y Direction
- Use thermostable, cycle-proof base materials (fillers)
- Have an optimized stackup
- Use resin-optimized prepregs
- Use an electroless nickel immersion gold finish (Ni clamping effect)
- Directional ML layering (observance of weft/warp direction)
- Pressing of a single material
- Select suitable materials for prepregs and inner layers
- Adapt the pressing program to the stackup and to the material properties
- Ensure optimum heat distribution in the pressed stack
- Compensate for the shrinkage behavior of the pressed part by adjusting the inner layer layout (scaling factor)
High data rate/high frequency (permittivity Dk, dielectric loss factor Df)
For this purpose, hybrid stackups with high-frequency laminates are used in combination with standard FR4 along with single-material multilayers containing materials with the relevant Dk and Df values.
Learn more under
3.3.1 High-Frequency PCB | General
3.3.2 High-Frequency PCB | Design Rules
Comparative Tracking Index (CTI)
A high CTI means that measurable currents on the surface of the test specimen only occur once a correspondingly high high voltage is applied.
The CTI (comparative tracking index) is sometimes referred to as the “tracking resistance”. The CTI value indicates the voltage that can be achieved without the base material exhibiting any tracking (base material becomes conductive under voltage) when 50 drops (1 drop every 30 seconds) of standardized electrolyte solution are dripped onto it.
Failure criterion is a creepage current of > 0.5 A.
Dielectric strength | Insulation-coordination
FED – Isoko-Tool
Conductive Anodic Filament (CAF)
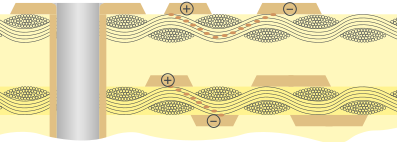
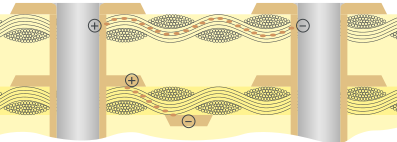
- Anodic dissolution of copper in the base material
- Migration along the glass fabric (primarily at fault zones)
- Formation of conductive filaments due to corrosion reaction – (high-resistance) short circuit!
CAF (Conductive Anodic Filaments) – Influencing Factors
- Glass fabric
- Ionic impurities
- Matching of glass and resin
- Wettability of the glass
- Hole spacing
- Conductor spacing
- Single-ply stackups
- Drilling quality
- Cleaning of the hole wall
- Replating (wicking)
- Pressing process (to an extent)
- Temperature
- Humidity
- Voltage
- Spacing (anode ↔ cathode)
- Ionic impurities
CAF (Conductive Anodic Filaments) – Test Method IPC-TM-650 2.6.25A
The different test criteria are summarized in the table on the right.
| Test criteria | Values |
|---|---|
| Min. spacing | 0.27 mm, 0.38 mm, 0.51 mm or 0.65 mm |
| Temperature | 65 °C or 85 °C (± 2 °C) |
| Humidity | 87 % (+3/-2 %) |
| Voltage | 10 V to 100 V |
| Duration | 500 h to 1,000 h |
Blog
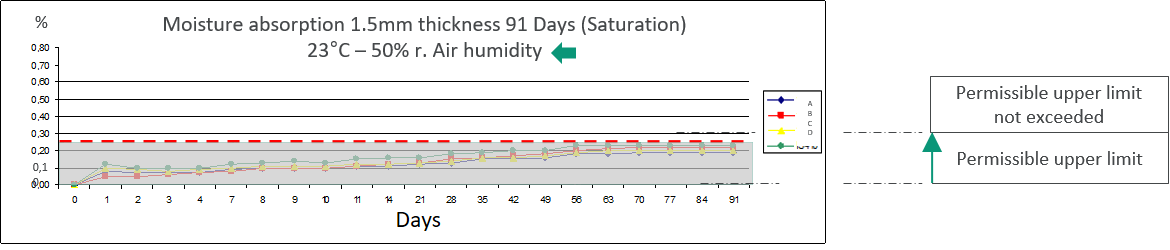


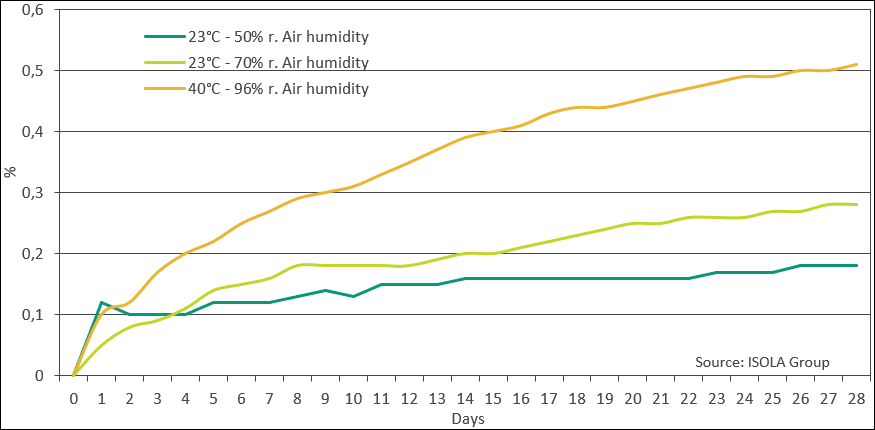
Values for moisture absorption can be found in the respective Data sheet for Base materials.
Keywords
- Glass transition temperature (Tg)
- Coefficient of thermal expansion (CTE)
- Conductive anodic filament (CAF) resistance
- Comparative tracking index (CTI)
- IPC-4101
- Halogen-free
- High frequency
- Reliability
- Dielectric strength
- Material selection